On this course we were provided with various research themes on AGI with a mix of its methodology and applications from different lecturers each week. It was fruitful to enlarge our resurcefulness and vision of AGI. In this blog I will try to convey my perception and discuss them.
"No man ever steps in the same river twice, for it's not the same river and he's not the same man"
From this quote of Greek philosopher Heraclitus, cited by Prof. Hui Lin, we began our courses on Selected Topics of GeoInformatics. He presented us the evolution of geographic language from maps to GIS and VGE. In our days GIScience has been growing rapidly and its results have been using everywhere. Google Earth is by far the most used GIS application in the world. In its turn VGEs, acronym for Virtual Geographic Environment, can help the user better understand geographic information through multi-sensory interaction and, hence improve understanding of real-world patterns and processes.
1) G. Kothencz: "How green are these areas from the bird's view?"
 G.Kothencz "Attitude toward Urban Green Development"
 On this lecture we offered to rate these five places on 5 ball scale (1-greenest, 5-least green), shown on the map of Salzburg on the right. I rated them as following:
2) Dr. Shahnawaz: "Assessing Quality of Life (QoL hereafter) in GeoSpatial Perspective"
Urban QoL can be assessed using satellite image and socioeconomic data in GIS. I agree on the propositions that Dr. Shahnawaz cited and I want to add that the industrial and infrastructural factors, such as housing quality and naturre of roads also can affect to the QoL The research uses subjective indicators and the purpose is to evaluate QoL using GIS approach for avoidness of poverty of decision-making.
As for as task, that we assigned I chose my hometown Almaty from Google Maps (Fig. 1) and based on my perception, tried to identify the areas representing High, Medium and Poor Geo-QoL. The green areas shows Higher Geo-QoL, Yellow identifies Moderate Geo-QoL and Red areas have Lower Geo-QoL (Fig. 2). The reason for that is in Green areas there are a lot of mountain ranges and intact nature with a large vegetation. This means that there are air is clearer and much less air pollution. In Yellow areas there are located factories and other constructions, so pollution occurs compare to Green areas. Nowadays there are placed tendency to cut trees to build houses and other buildings, which is not so good for ecology, that is health of people. Red Areas indicates that there are a huge portion of contamination comparing to previous two areas, because of most lively part of city and a lot of traffic.
- 1- Mirabell Garden
- 2- Mönchsberg
- 3- Residenzplatz
- 4- Südtiroler Park
- 5- Europark
- 1- Mirabell Garden
- 2- Europark
- 3- Mönchsberg
- 4- Residenzplatz
- 5- Südtiroler Park
2) Dr. Shahnawaz: "Assessing Quality of Life (QoL hereafter) in GeoSpatial Perspective"
Urban QoL can be assessed using satellite image and socioeconomic data in GIS. I agree on the propositions that Dr. Shahnawaz cited and I want to add that the industrial and infrastructural factors, such as housing quality and naturre of roads also can affect to the QoL The research uses subjective indicators and the purpose is to evaluate QoL using GIS approach for avoidness of poverty of decision-making.
As for as task, that we assigned I chose my hometown Almaty from Google Maps (Fig. 1) and based on my perception, tried to identify the areas representing High, Medium and Poor Geo-QoL. The green areas shows Higher Geo-QoL, Yellow identifies Moderate Geo-QoL and Red areas have Lower Geo-QoL (Fig. 2). The reason for that is in Green areas there are a lot of mountain ranges and intact nature with a large vegetation. This means that there are air is clearer and much less air pollution. In Yellow areas there are located factories and other constructions, so pollution occurs compare to Green areas. Nowadays there are placed tendency to cut trees to build houses and other buildings, which is not so good for ecology, that is health of people. Red Areas indicates that there are a huge portion of contamination comparing to previous two areas, because of most lively part of city and a lot of traffic.
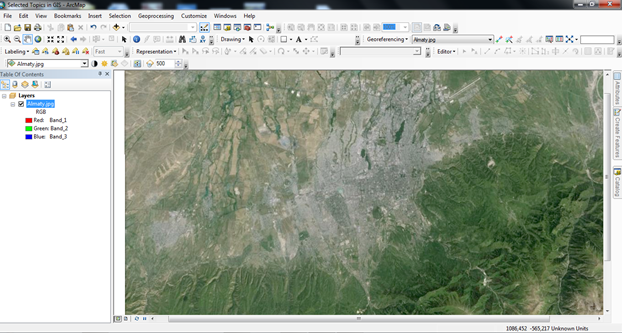 Fig 1. Almaty image source: Google map |  Fig 2. Raster Classification of Almaty in ArcMap |
3) I.Tomljenovic: "LIDAR as another tool for surveyors, geographers,.."
On that lecture we opened for us the tool called LIDAR, short for Light Detection And Ranging. It is analogous to RADAR, but using the infra-red portion of the Electromagnetic spectrum. The difference of LiDAR from the usual tool for us, RADAR, is that it sends a laser beam. It can be used to detect very small objects such as dust particles or various aspects of different weather and atmospheric phenomena. We remember Doppler effect, which says following: "Change of wavelength or frequency of a wave caused by motion of the source".
I think that this presentation was very detailed about LIDAR and covered all questions related how it works and where to apply it, etc. I recommend it for everyone who are interested and want to dig on the LIDAR topic deeper.
4) P. Hofmann: "Agent Based Image Analysis of Remote Sensing Data"
We discussed two terms, that are ABIA and OBIA. OBIA, stands for Object-Based Image Analysis, is an intersection of GIS and RS. As solution for drawbacks of OBIA, such as complicated rule sets, incapacity in automation of image analysis of several similar images acts ABIA. It is flexible to any environmental change and automated to cope with it.
From my point of view, the results of ABIA is more reliable than OBIA and OBIA, in its turn, can be extended to ABIA, if we adapt image objects to IOAs.
5) I. Sitko: "If it does not fit Excel, it is Big Data"
In my opinion, nowadays it is impossible to image the modern world without Big Data, because technology is changed dramatically and it requires new level on storage and manage of data, BIG data. There is a huge necessity to increase storage capacity and data generation, due to the growth of information each second, even milli- or nanosecond. But you may ask "Why Big Data for GeoInformatics?" Because
- GPS-coordinates
- ATM
- Defining or assignin a Geo-Location (e.g.Twitter, Foursquare, Instagram and other social websites)
- Traffic arrangements in cities
- Georeference to a location (e.g. Facebook, tweets, Flickr images, Youtube, etc)
6) F. Albrecht: "Safe Emergency Landing in Alpine Terrain-Developing GeoData for Aviation"
Many fields benefit from geoInformatics, and an Aviation is not an exception. From this presentation I got acquainted with the SELIAT technology. I think that this technology is very useful, because GIS Technology applied in emergency case is really supportive to make a decision quick and can rescue lives, where sometimes is necessary to react in critical situations urgent. In addition to meterological data from sensors, it also would be good to explore the ground (its steepness, absence of any vegetation), where a plane will land.
7) M. Loidl: "GIS in Mobility Research and Planning"
All of us aware that in our globalized world the mobility is very important and cannot be ignored. Because the term "time" acts a key role on physical space, where the mobility takes a place. And GIS provides it with efficiency and handicap of other unnecessary impacts, like social and environmental.
8) P.Zeil: "Copernicus Emergency Management Service"
The Copernicus is an EU Programme, which based on satellite Earth Observation and in situ data. The aim of programme to monitor and forecast the state of the environment, sea and climate, and develop strategies of improvement of the security of people.
On the website of Copernicus the map in two mode, that is rush and non-rush. In my opinion the EC should contribute to advance this programme and focus on the way to react to the critic events on the spot and colloborate with other organisations that have a relation to the Emergency Management Service.
9) R. Kounadi: "Private GeoInformation Disclosure"
Since the existence of omni-present applications with geo-location (cell-phones and other) now that are aware of your physical location, GeoPrivacy is very important for people. Learning the location of personal devices usually implicitly discloses the location of their owner- it can help to trace a person, to identify that person's interests or to detect other informations related to that person. It is thus crucial to protect the past, current and future locations of an individual from disclosure (except by explicit consent of the person concerned).
Location Protection Methodologies, such as Geographical Masks, Pseudonyms and Cloaking allows to keep an anonymity to users, but it is still possible to calculate errors of distortion and define the confidential location (it may be not bad though, especially in the case of tracking a criminal).
 RSS Feed
